


TL;DR
Data analytics is one of the most competitive fields in tech right now. The role spans business intelligence, product analytics, marketing analytics, financial analytics, and a dozen other domain-specific specialties. Job titles vary widely. The same job posting at two companies can describe completely different work.
That’s why this resume guide on data analytics walks you through every section of your resume with concrete examples that hiring managers actually respond to.
What Makes a Data Analytics Resume Different From Other Tech Resumes
Most tech resumes get evaluated on engineering output. A data analytics resume gets evaluated on something harder to quantify: whether your analysis changed what a business did.
A data analyst sits between raw data and the people who make decisions with it. Hiring managers know this. They scan your resume for evidence that you can pull the right data, ask the right questions of it, and translate the answers into something a non-technical stakeholder can act on.
The data analytics resume challenge is showing that you can do all three. Tool fluency on its own is a baseline expectation. What separates competitive candidates is domain context and the ability to translate analysis into business outcomes.
What Hiring Managers Look for in a Data Analytics Resume
Hiring managers for data analytics roles typically come from one of two backgrounds. Either they were analysts themselves and now lead a team, or they are business stakeholders who hire analysts to support their function. Both groups read your resume looking for slightly different things, and a strong resume signals to both.
Core Technical Competencies
Hiring managers want explicit hands-on experience with the tools that make up a modern analytics stack. SQL is non-negotiable for almost every role. Beyond that, they look for fluency in at least one of Python or R, a BI tool such as Tableau, Power BI, or Looker, and familiarity with cloud data warehouses like Snowflake, BigQuery, or Redshift.
The specifics matter. Listing “Python” tells a hiring manager nothing if the role calls for pandas-heavy analytical work and your Python experience was a coding bootcamp exercise. Naming the libraries you actually use, such as pandas, NumPy, scikit-learn, or statsmodels, reads as far more credible.
Analytical Methodology
Tools are the easy part. What separates a competitive data analytics resume is evidence that you understand which method to apply to which question. A/B testing, cohort analysis, regression analysis, time series forecasting, and funnel analysis are common methodologies that show up in product and marketing analytics roles. Hypothesis testing, statistical significance, and confidence intervals show up in any role that involves experimentation.
Business Communication and Stakeholder Work
Most analytics work fails at the communication layer rather than the technical one. A perfectly correct analysis that nobody acts on produces zero business value. Hiring managers know this, and they look for evidence that you can build dashboards stakeholders actually use, present findings to non-technical audiences, and turn ambiguous business questions into something a SQL query can answer.
Bullets that reference dashboard adoption rates, recurring stakeholder syncs, or cross-functional projects with marketing, product, or finance teams signal this kind of work. Resumes that focus only on the technical pipeline tend to undersell this layer.
Domain Knowledge
Data analytics roles increasingly hire for domain context as much as technical skill. A product analytics role at a SaaS company wants someone who understands engagement metrics, retention, and feature adoption. A marketing analytics role wants someone who understands attribution, LTV, and acquisition funnels. A healthcare analytics role wants someone who understands the regulatory and data complexity of that space.
If you have domain experience, surface it explicitly. Hiring managers will scan for it.
How to Write a Data Analytics Resume Step by Step
Write a Targeted Summary or Objective
Data analytics is a wide field, and your resume summary needs to do the work of placing you within it before a hiring manager reads any further. Three or four sentences is the right length. Anything longer gets skimmed, and anything shorter does not give enough signal.
If you have two or more years of experience, write a professional summary. Lead with your years of experience and the type of analytics work you have done. Follow with two or three specific technical strengths that align with the role. Close with a business outcome that shows your work moved a metric.
❌ A weak summary looks like this:
“Detail-oriented data analyst with strong SQL skills and a passion for turning data into insights.”
✅ A stronger one looks like this:
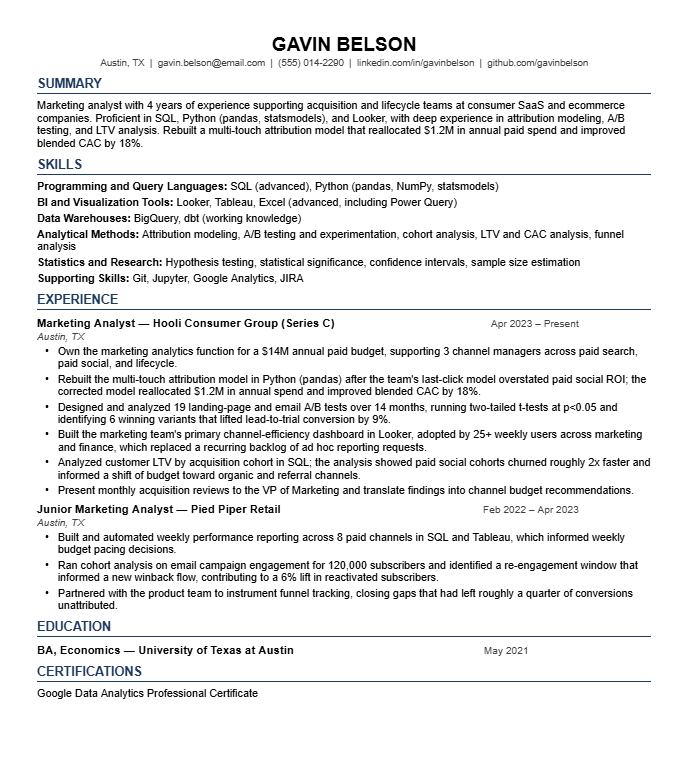
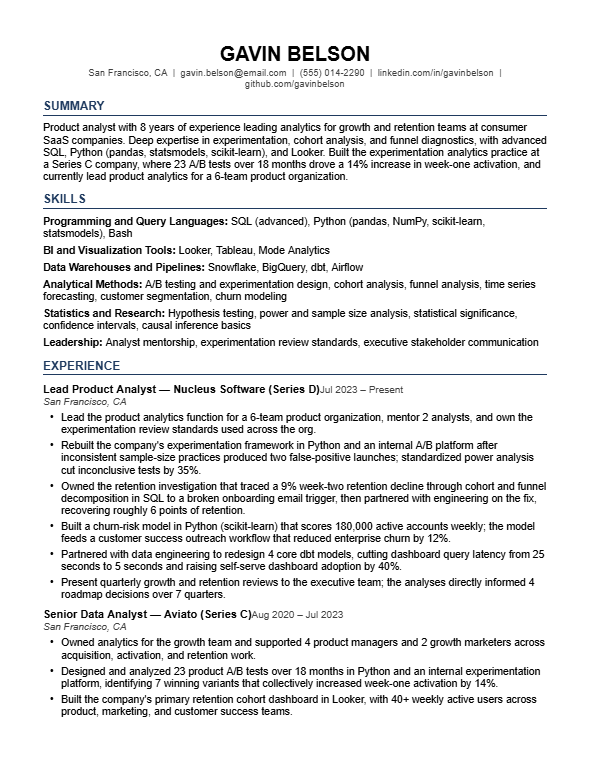
“Product analyst with 4 years of experience supporting growth and retention teams at consumer SaaS companies. Proficient in SQL, Python (pandas, statsmodels), and Looker, with deep experience in cohort analysis, A/B testing, and funnel diagnostics. Identified an onboarding drop-off pattern that informed a redesign and increased 30-day retention by 11% across 200,000 monthly signups.”
The second version names a domain, specific tools, an analytical specialty, and a quantified business outcome. A hiring manager reading the first two sentences knows exactly what kind of analyst you are.
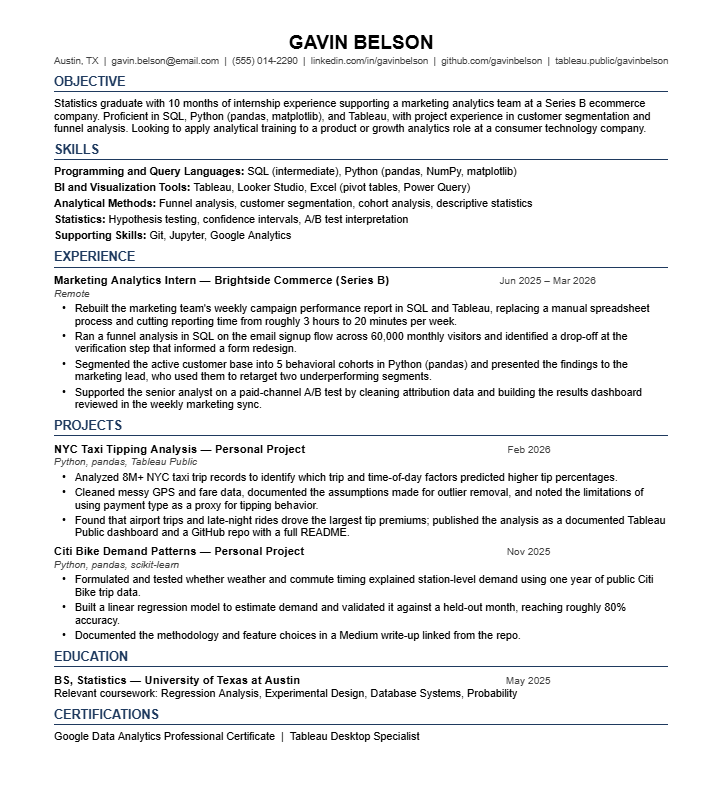
If you are entry-level or transitioning into analytics, use an objective statement that connects your existing background to data work credibly.
“Recent computer science graduate with 1 year of internship experience supporting a marketing analytics team at a Series B SaaS company. Proficient in SQL, Python, and Tableau, with project experience in attribution modeling and customer segmentation. Looking to apply analytical training to product or growth analytics work in a fast-moving consumer technology environment.”
A few principles apply regardless of experience level:
Build a Skills Section That Speaks to Hiring Managers
Data analytics pulls from more disciplines than most tech roles. SQL, programming, BI tools, statistical methods, cloud infrastructure, and business domain knowledge all overlap here. A flat list of 30 mixed items is hard to read and easy to skip. Organize your skills section into clear categories so a hiring manager can find what they need quickly.
- Programming and Query Languages: SQL (advanced), Python (pandas, NumPy, scikit-learn, statsmodels), R (tidyverse, ggplot2), Bash
- BI and Visualization Tools: Tableau, Power BI, Looker, Looker Studio, Mode Analytics, Metabase
- Data Warehouses and Pipelines Snowflake, BigQuery, Redshift, dbt, Airflow, Fivetran
- Analytical Methods: A/B testing and experimentation, cohort analysis, funnel analysis, regression modeling, time series forecasting, customer segmentation, attribution modeling
- Statistics and Research: Hypothesis testing, confidence intervals, statistical significance, sample size estimation, causal inference basics
- Supporting Skills: Excel (advanced including pivot tables and Power Query), Git, Jupyter, JIRA, basic Python notebook deployment
A few things to get right here:
How to Frame Your Work Experience in a Data Analytics Role
Data analytics work is harder to frame on a resume than most people think. The technical pipeline of pulling data, cleaning it, analyzing it, and visualizing it is not what hiring managers are evaluating. They are evaluating whether your work changed what the business did. Your job is to make the analytical thinking visible in the work experience section without burying every bullet in technical detail.
Here is how to approach it:
❌ Instead of: “Built dashboards in Looker for the marketing team.”
✅ Try: “Built and maintained the marketing team’s primary attribution dashboard in Looker. The dashboard tracked spend efficiency across 12 paid channels and informed a $400,000 quarterly budget reallocation.”
A rough structure for each role entry:
Senior Data Analyst | Consumer SaaS Company (Series C) | Austin, TX | Jun 2023 to Present
Quantify Your Impact With Metrics
Data analytics work produces more quantifiable signals than most people put on their resumes. The challenge is knowing which metrics carry weight with hiring managers and how to surface them when your analysis was one input into a larger business decision.
Here are some examples to draw from:
Business outcome metrics
Scope and ownership metrics
Process improvement metrics
Methodology metrics
What to do when clean metrics are not available
Many analytics teams do not formally track the business impact of every piece of work. If that describes your last role, quantify the scope instead. How many stakeholders did you support? How large were the datasets you queried? How many dashboards did you maintain? What was the volume of ad hoc requests you handled monthly?
Scope metrics are weaker than outcome metrics, but they are significantly stronger than purely descriptive bullets.
One practical step before writing your resume: pull up your old SQL queries, dashboard usage analytics, experiment write-ups, and email threads with stakeholders. Numbers you have forgotten about tend to surface there. A short audit often produces enough data to strengthen multiple bullets at once.
How to Include Data Analytics Side Projects and Portfolio Work
Side projects on a resume carry real weight in data analytics hiring, especially for candidates with less than two years of formal experience. The work translates directly. A well-documented analysis on a public dataset shows the same skills a hiring manager wants to see in your professional bullets.
Here is how to present analytics side projects credibly:
How to Frame Adjacent Experience as Data Analytics Work
If your last title was Marketing Coordinator, Operations Analyst, Finance Associate, or Business Analyst, your resume likely undersells how much of your work was analytics in practice.
Pulling SQL queries to answer ad hoc business questions is data analytics. Building Excel models that informed pricing decisions is data analytics. Running A/B tests on email subject lines is data analytics. Most people in adjacent roles do analytical work without framing it that way on a resume.
When rewriting your bullets, foreground the analysis rather than the function. Instead of “managed weekly marketing reporting,” write “built and automated the marketing team’s weekly performance reporting in SQL and Tableau. The reporting tracked spend efficiency across 8 paid channels and informed weekly budget pacing decisions.” The underlying work is the same. What changes is that the analytical layer becomes visible.
If you come from a finance or operations background, connect your domain expertise to analytics work explicitly. Forecasting, variance analysis, KPI design, and financial modeling are all analytical methodologies. A hiring manager looking for an FP&A analyst with strong SQL skills will respond to that framing.
On the title gap: use a functional clarifier like “Marketing Coordinator (Marketing Analytics and Reporting)” and address the trajectory in your summary. Honest framing carries more weight than an inflated title that breaks down in a technical screen.
Data Analyst Resume Examples
Entry-Level Data Analyst Resume Example
Mid Level Data Analyst Resume
Senior Level Data Analyst Resume
Common Data Analytics Resume Mistakes to Avoid
Listing tools without showing how you used them
Naming SQL, Python, and Tableau in your skills section without anywhere on your resume showing the work you did with them tells a hiring manager nothing. Every applicant lists these tools. What separates competitive resumes is bullets that reference the tools in context, with the analytical method and the outcome attached.
Writing bullets that describe data pipelines instead of business outcomes
“Pulled data from Snowflake using SQL and visualized in Tableau” describes a workflow, not your contribution. A hiring manager reading that bullet has no information about what business question your analysis answered or whether anyone acted on the result. Every analytics bullet should connect a data task to a decision someone made because of it.
Inflating proficiency on tools you have used once
If your only Python experience was a coursework assignment, listing it next to SQL at the same level signals overstatement to anyone who has read more than a few resumes. Most data analytics interviews include a technical screen that will surface the gap quickly. Be honest about what you actually use day-to-day versus what you have been exposed to.
Burying the business context
Data analytics is a business function before it is a technical one. A resume that reads as a list of technical tasks without any reference to revenue, retention, conversion, or cost reads as inexperienced even if the technical work was strong. Hiring managers want to see that you understand why a business hires analysts.
Ignoring stakeholder work and communication
Most data analytics work happens at the boundary with non-technical stakeholders. If you have presented findings to executives, run training sessions on dashboards, or translated business questions into analytical work, that belongs on your resume. Bullets that focus only on the technical pipeline undersell a layer that hiring managers weigh heavily.
Treating Kaggle competitions as production experience
Kaggle work is useful supporting evidence, but it is bounded experience on clean datasets with predefined questions. A hiring manager evaluating production analytics experience will not weigh a Kaggle silver medal the same as 18 months of work on a stakeholder-facing analytics team. Include Kaggle work, but do not let it crowd out your professional bullets.
Sending the same resume to every analytics role
Product analytics, marketing analytics, BI engineering, and data science roles all live under the analytics umbrella, but they evaluate different signals. Adjust your summary, your skills emphasis, and your most-foregrounded bullets for the specific function the role sits in.
Why You Should Tailor Your Resume for Different Data Analytics Roles
Data analytics roles vary widely in scope. A product analytics role at a consumer SaaS company looks for different things than a BI role at a financial services company or a marketing analytics role at an ecommerce business.
Tailoring your resume for each application is necessary if you want to compete seriously, but doing it manually for every role is slow and easy to get wrong.
This is where an AI resume optimizer tool like Upplai can help. Here is how Upplai simplifies your data analytics job search:
If you are worried about getting trapped in subscription fees, Upplai’s pricing is straightforward. You get 200 ATS scores per month, three tailored resumes, and unlimited downloads with no credit card in the free plan. If you need additional resumes, you can pay $0.50 or $1.00 each with no subscription attached.